02 / Data evaluation
Exoplanet
Model Evaluation.
A rare positive class made this an exercise in understanding errors. The question was how well each classifier found the labeled exoplanet examples—and what it incorrectly flagged along the way.
Project outcome
The error pattern mattered
more than the headline accuracy.
The three-classifier comparison exposed a detection-versus-false-alarm tradeoff on a highly imbalanced test set. The team’s presentation of the work received Inspirit AI’s Best Presentation award.
Kepler light-curve data
A small signal.
A consequential distinction.
The supplied data contained 3,197 flux features for each example, plus its label. Positive examples were uncommon in both the provided training and test sets.
37 positive · 5,050 negative
5 positive · 565 negative
Five positive examples make missed detections particularly important when interpreting overall accuracy.
Interactive comparison / Saved notebook outputs
Same test set.
Different errors.
570 examples
565 negative · 5 positive
K nearest neighbors
- Test accuracy
- 99.1%
- Positive examples detected
- 0 of 5
- False positives
- 0
- Positive recall
- 0%
- Precision
- —
High overall accuracy masked all five missed positive examples.
Positive denotes a star labeled as having an exoplanet. Matrix colors use the same 0–565 scale for every model. Precision is undefined when there are no positive predictions. Values are calculated from the saved test confusion matrices.
What I contributed.
I helped lead the project and presented the model comparisons through graphs and explanations.
Our team worked in a provided Python notebook, using pandas and NumPy for data handling, Matplotlib for visualization, and scikit-learn classifiers. My role included helping communicate what the results meant rather than relying on a single accuracy score.
From light curves to a comparison.
Each example contained 3,197 flux features and one class label. The notebook used the supplied training and test files, removed the label from the feature matrix, and mapped the labels to 0 for negative and 1 for positive.
Understand the imbalance
Only 37 of 5,087 training examples were positive. The test set contained five positives among 570 examples.
Fit three baseline classifiers
Compare KNN, logistic regression, and a decision tree on the original flux features.
Inspect both kinds of error
Count missed positives and false alarms alongside accuracy, then explain the tradeoff.
| Classifier | Recorded setting | Training accuracy |
|---|---|---|
| K nearest neighbors | 5 neighbors | 99.3% |
| Logistic regression | Maximum 1,000 iterations | 92.7% |
| Decision tree | Default classifier settings; no fixed random seed recorded | 100.0% |
Swipe or scroll horizontally to see every column.
The baseline tree fit the training set perfectly, while detecting only two of five positives in the test set. Training fit and useful positive detection were different questions.
Read the tradeoff in the numbers.
Higher accuracy did not mean better positive detection.
KNN matched the 99.1% accuracy of an always-negative prediction: it missed all five positives. Logistic regression found four positives, but generated 198 false alarms. The baseline tree found two positives with five false alarms.
| Classifier | Accuracy | Recall | Precision | Positive hits | False alarms |
|---|---|---|---|---|---|
| K nearest neighbors | 99.1% | 0% | — | 0 of 5 | 0 |
| Logistic regression | 65.1% | 80% | 2.0% | 4 of 5 | 198 |
| Decision tree | 98.6% | 40% | 28.6% | 2 of 5 | 5 |
Swipe or scroll horizontally to see every column.
Recall asks how many of the five positives were detected.
Precision asks how many positive predictions were correct. It is undefined for KNN because that run made no positive predictions.
The choice depends on what happens after a positive prediction. A search that can tolerate follow-up review may value detection differently from one with very limited review capacity. These five positive examples are too few to establish a reliable deployment choice.
A second experiment.
Balancing training data did not automatically recover more positives.
The guided notebook also explored Fourier-magnitude features, Savitzky–Golay smoothing with a 21-sample window and fourth-order polynomial, normalization, robust scaling, and SMOTE augmentation of the training set.
Training examples / Shared scale: 0–10,100
SMOTE added 5,013 synthetic positive training examples. The test set remained at 570 examples.
| Saved run | Accuracy | Positive hits | Missed positives | False alarms | Precision |
|---|---|---|---|---|---|
| Baseline tree | 98.6% | 2 of 5 | 3 | 5 | 28.6% |
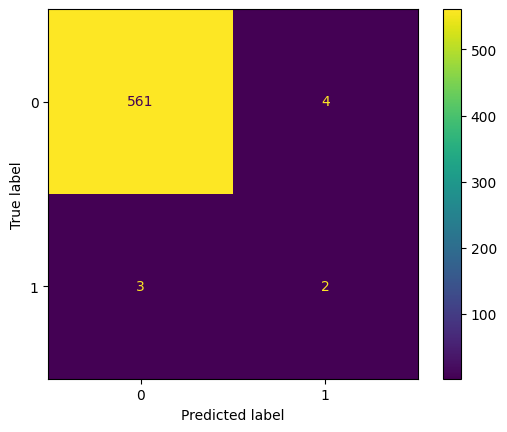
| Processed + SMOTE tree | 98.8% | 2 of 5 | 3 | 4 | 33.3% |
Swipe or scroll horizontally to see every column.
The saved processed run still detected two of five positives, with one fewer false alarm. Its test matrix contained 561 true negatives, four false positives, three false negatives, and two true positives.
View the original saved test matrix
How to interpret this experiment
Several preprocessing steps changed together, and the normalization function used extrema from both the training and test inputs. This makes the result exploratory rather than a leakage-free evaluation of SMOTE alone. The notebook also did not fix a random seed for the decision tree or SMOTE.
A follow-on evaluation should fit every learned preprocessing step on training data alone, hold the test set aside, and compare repeat runs with recorded settings.
What I would evaluate next.
Five positive test examples limit the strength of a conclusion.
I would evaluate more positive held-out examples, fit preprocessing on training data alone, and repeat comparisons with fixed random seeds and recorded model settings. I would keep precision and recall beside accuracy and inspect individual errors to understand which examples the models still miss.
Project records: Planet Hunters Section 2 notebook and Searching for Exoplanets team presentation. The three-model comparison uses the notebook’s saved baseline test outputs; the later processed-tree experiment is identified separately. Metrics are calculated from those saved confusion matrices. This was a guided team classification project.